Excel'de gerçek ve bütçe grafiği oluşturma (Adım Adım Kılavuz)
Excel'de Gerçek ve Bütçe grafiği oluşturmak, projelerin veya görevlerin hedef değerlerine ne kadar iyi ulaştığını görselleştirmek için harika bir yöntemdir. Örneğin, aşağıdaki resimlerde gösterildiği gibi hedef değerleri grafiğe çubuklar veya çizgiler olarak temsil edebilirsiniz. Bu öğretici, Excel'in yerleşik özelliklerini veya Kutools for Excel'in gelişmiş grafik araçlarını kullanarak bu grafikleri adım adım oluşturmanıza rehberlik edecektir, böylece grafiklerinizi belirli verilerinize göre özelleştirebilir ve uyarlayabilirsiniz.
| |

Excel'de 6 adımda gerçek ve bütçe grafiği oluşturun
Güçlü bir Grafik aracı kullanarak Excel'de 3 adımda gerçek ve bütçe grafiği oluşturun
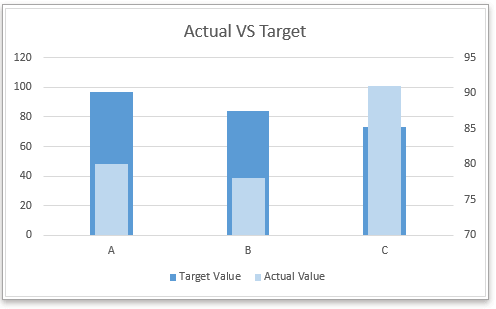
Hedef değerleri çubuklar olarak gösteren Gerçek ve Bütçe grafiği oluşturma
1. Veri aralığını seçin ve tıklayın Ekle > Sütun veya Çubuk Grafiği Ekle > Kümelenmiş Sütun. Ekran görüntüsüne bakın:

2. Eklenen grafikte, sağ tıklayın Gerçek Değer serisive ardından bağlam menüsünde Veri Serisini Biçimlendir.

İpucu: Hedef Değer serisi grafikte ikinci sırada ise, bu adımda Hedef Değer serisine sağ tıklamanız gerekir.
3. Açılan Veri Serisini Biçimlendir bölmesinde (Excel 2010 veya önceki sürümlerde bir iletişim kutusu açılır) işaretleyin Bağlı Eksen seçeneğini işaretleyin ve ardından Aralık Genişliği yüzdesini ayarlayın Gerçek Değer Serisidaha ince görünene kadar ayarlayın Hedef Değer serisinden.

Şimdi bir gerçek ve bütçe grafiği oluşturuldu.
Opsiyonel adımlar:
4. İkincil y eksenini kaldırın.

5. Seri dolgu rengini ihtiyacınıza göre değiştirin. Sağ tıklayın Gerçek seri, seçin Veri Serisini Biçimlendir bağlam menüsünden. Açılan Veri Serisini Biçimlendir bölmesinde, Doldur & Çizgi sekmesinde işaretleyin Katı dolgu seçeneğini işaretleyin ve doldurma rengini değiştirin Renk açılır listeden. Ekran görüntüsüne bakın:

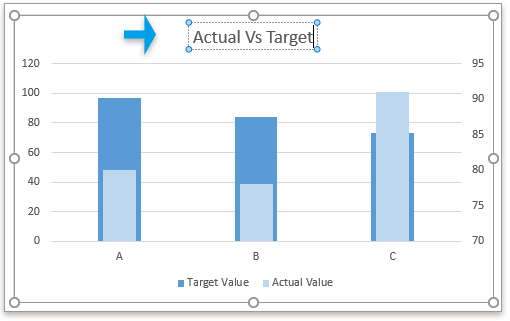
6. Başlığı ihtiyacınıza göre değiştirin.
Hedef değerleri çizgiler olarak gösteren Gerçek ve Bütçe grafiği oluşturma
1. Veri aralığını seçin ve tıklayın Ekle > Sütun veya Çubuk Grafiği Ekle > Kümelenmiş Sütun. Ekran görüntüsüne bakın:

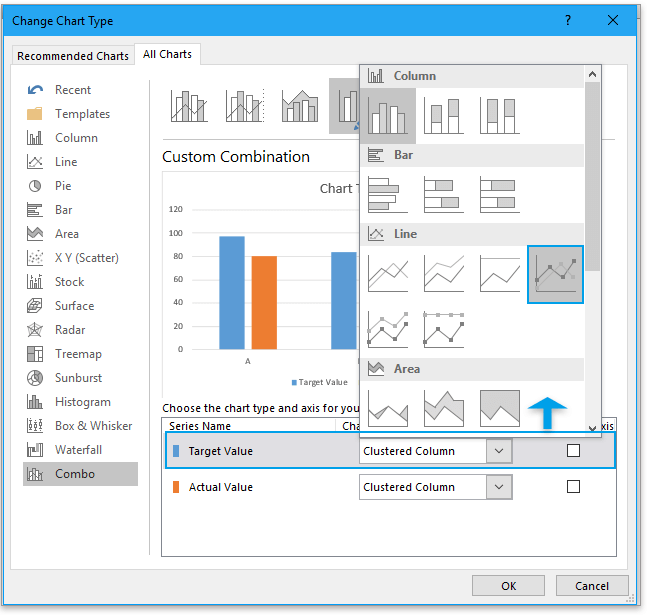
2. Eklenen grafikte, sağ tıklayın Hedef Değer serisi, ve bağlam menüsünden Serinin Grafik Türünü Değiştir tıklayın.

3. Açılan Grafik Türünü Değiştir diyalogunda, Hedef Değer yanındaki açılır listeye tıklayın Veri seriniz için grafik türünü ve ekseni seçin section, select Line with Markers chart and then click OK. See screenshot.
4. Right click at the Line with Markers chart, select Format Data Series from the context menu.

5. In the Format Data Series pane, under Fill & Line tab, go to the Line section, and check No line option in the Line options group.

6. Go to the Marker section, under Marker Options group, check Built-in option, choose the line type from the drop-down list of Type, then change the Size as you need.

Now the target values as lines chart has been created.
Additionally, you can change the fill color of the series and update the chart title as needed.
Tip: If you want to use the actual vs budget chart next time, you can save this chart to the Auto Text tool of Kutools for Excel which can collect charts and allow you to reuse them in anywhere anytime. All you need to do is update the chart references to match your specific requirements. Click to free download Kutools for Excel now. |

If you have Kutools for Excel installed, you can apply the Target and Actual Chart tool from the Charts group to quickly solve this job with 3 clicks.
1. Click Kutools > Charts > Progress > Target and Actual Chart.
2. In the Actual vs Target Chart dialog, select one chart type you want to create in the Chart Type section, then select x labels, target values and actual values as you need.
3. Click Ok, then a target vs actual chart has been created.

Tip:
1. If this is your first time using the tool, click the Sample button to see how it works.
2. You can change the chart color in the Format tab in Excel.
Kutools for Excel - Excel'i 300'den fazla temel araçla güçlendirin. Sürekli ücretsiz AI özelliklerinden yararlanın! Hemen Edinin
Sample File
Create a bell curve chart template in Excel
Bell curve chart, named as normal probability distributions in Statistics, is usually made to show the probable events, and the top of the bell curve indicates the most probable event. In this article, I will guide you to create a bell curve chart with your own data.
Break chart axis in Excel
When there are extraordinary big or small series/points in source data, the small series/points will not be precise enough in the chart. In these cases, some users may want to break the axis, and make both small series and big series precise simultaneously.
Move chart X axis below negative values/zero/bottom in Excel
When negative data existing in source data, the chart X axis stays in the middle of chart. For good looking, some users may want to move the X axis below negative labels, below zero, or to the bottom in the chart in Excel.
Create a bubble chart in Excel
In Excel, a Bubble chart is a variation of a Scatter chart and its data is pointed as bubble. And if your each series has three data as shown as below, creating a Bubble chart will be a good choice to show the data series vividly.
Create bubble chart with multiple series in Excel
This tutorial will tell you how to create a bubble chart with multiple series in Excel step by step.
En İyi Ofis Verimlilik Araçları
Kutools for Excel ile Excel becerilerinizi güçlendirin ve benzersiz bir verimlilik deneyimi yaşayın. Kutools for Excel, üretkenliği artırmak ve zamandan tasarruf etmek için300'den fazla Gelişmiş Özellik sunuyor. İhtiyacınız olan özelliği almak için buraya tıklayın...
Office Tab, Ofis uygulamalarına sekmeli arayüz kazandırır ve işinizi çok daha kolaylaştırır.
- Word, Excel, PowerPoint'te sekmeli düzenleme ve okuma işlevini etkinleştirin.
- Yeni pencereler yerine aynı pencerede yeni sekmelerde birden fazla belge açıp oluşturun.
- Verimliliğinizi %50 artırır ve her gün yüzlerce mouse tıklaması azaltır!
Tüm Kutools eklentileri. Tek kurulum
Kutools for Office paketi, Excel, Word, Outlook & PowerPoint için eklentileri ve Office Tab Pro'yu bir araya getirir; Office uygulamalarında çalışan ekipler için ideal bir çözümdür.
- Hepsi bir arada paket — Excel, Word, Outlook & PowerPoint eklentileri + Office Tab Pro
- Tek kurulum, tek lisans — dakikalar içinde kurulun (MSI hazır)
- Birlikte daha verimli — Ofis uygulamalarında hızlı üretkenlik
- 30 günlük tam özellikli deneme — kayıt yok, kredi kartı yok
- En iyi değer — tek tek eklenti almak yerine tasarruf edin